Auroville’s population: A 20-year analysis
FeatureBy Alan
Keywords: Population, Population statistics, Demographics, Nationalities and Auroville International (AVI)
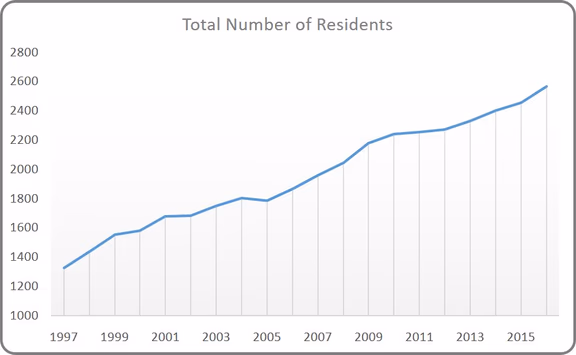
1 Total number of residents from 1997 to 2016
At a recent community meeting on the Auroville economy, the presenters made an assumption that the population will grow at the rate of 10% every year. How realistic is this growth rate? If history is any guide, it doesn’t seem very likely.
Uneven growth
In the last 20 years (see Figure 2: Year-on-year growth rate over the last 20 years), we had the highest rate of growth of 8.8% in 1998. Since the year 2000, growth has been very uneven, swinging wildly between +6.6% and -1.1%. In 2004, the population shrank from 1803 in the previous year to 1783 residents. What drives these extreme ups and downs? Is it the inherent unpredictability of population figures? Or is it the lack of a sustainable Entry Policy?
What is a little surprising is that the average growth rate in the current decade 2007 – 2016 is 2.7%, which is lower than the average rate of 3.5% in the previous decade. So, if you go by decadal trends, Auroville’s growth rate is actually slowing down. Even if we take the current year’s high growth rate of 4.5% (perhaps driven by the new Entry Policy), we will reach just over 11,000 people by 2050. To reach a population of 25,000 residents by 2050, we will have to sustain an annual growth rate of nearly 7%. Clearly, if growth is a priority, something needs to change.
What about growth of specific nationalities? Here again, the picture over the last ten years is far from consistent (see Figure 3: Ten-year growth of major nationalities). Some nationalities, such as India (33.2%), France (29.6%) and USA (29.9%), are growing quickly. Others, such as Switzerland (-25.9%) and Canada (-4.2%), are actually shrinking. And there are yet others, such as Belgium (84.2%), who are growing at an extremely fast rate.
Some of the national growth figures are driven by active Auroville International (AVI) centres or just by historical connections with Auroville. In order to get a more generalised view of population trends, it is useful to collate the data into eight regional clusters – South Asia, Rest of Asia, Middle East & North Africa, Sub-Saharan Africa, Europe, North America, South America and Australia-Oceania (see Figure 4: Population trend by region).
Europe has the highest representation in Auroville, although the percentage of Europeans have reduced from 57.3% in 1997 to 46.9% in 2016. Residents from Europe and South Asia make up 89.4% of the current population, which leaves a thin sliver of representation to be divided amongst the other regions. Representation has reduced quite dramatically for some regions. For example, the percentage of South Americans has reduced from 1.6% in 1997 to 0.6% in 2016. Does this affect diversity in Auroville? Is it important to invite new Aurovilians from regions and countries that might have very different cultures and ways of being? How important is this for the project of human unity?
‘Pull of Auroville’
One of the ways in which we can measure the ‘pull factor’ of Auroville in different nations is to calculate the number of Aurovilians per one million population in the home country. For example, Auroville currently has two residents from Iceland, a country which has a population of about 0.3 million people. So the number of Aurovilians per million population is 2/0.3, which is a ‘pull factor’ of 6.67. But Iceland’s case, with just two residents, might not be truly representative of the ‘pull’ of Auroville in that country. To make the measure of ‘pull’ realistic, we have only considered nationalities with at least ten residents in Auroville.
Figure 7 ranks countries in terms of ‘pull factor’. As expected, France, with its deep connection with The Mother and a very active AVI centre, leads the table. And unsurprisingly, China, with its huge population, is ranked last. Although there are very many Indians in Auroville, it ranks 11 because only a very small section of the 1.3 billion Indians are aware of the idea of Auroville. Is there anything to be done to increase the awareness about Auroville in different parts of the world? Or should we let Auroville engage with the world organically, at its own pace? Perhaps there are factors at work that we do not fully understand.
Shooting stars
No analysis of the population of Auroville can be complete without talking about the shooting stars. These are nations that had representation in Auroville at some point in the last 20 years, but who no longer appear on the Register of Residents. These nations are Armenia, Estonia, Greece, Indonesia, Luxembourg, Morocco, New Zealand, Portugal, Thailand and Uzbekistan. We hope to see you again soon.